HR analytics: a comprehensive guide & key metrics


Most HR teams have data to work with — but it may be buried in disconnected systems, ignored dashboards, and metrics that don’t drive action. The result? Missed signals, wasted time, and unclear priorities across the employee lifecycle.
HR analytics can change that. It links data to decisions, revealing what’s working, what’s not, and where to focus. That’s critical for the 75% of HR leaders stepping into more strategic roles this year.*
This guide explains how HR analytics works, how it can drive business outcomes, and which metrics today’s People teams should track.
🤝 Bring your People data together
Leapsome’s HRIS provides a single source of truth for your HR function, enabling better insights and data-driven decision-making.
👉 Discover Leapsome’s HRIS
*Leapsome’s HR Insights Report, 2025
What is HR analytics?
HR analytics is the process of collecting and examining People data to uncover trends, issues, and opportunities across the employee lifecycle. It allows modern HR teams to work strategically and make strong, data-guided decisions on engagement, development, retention, and business performance.
Whether you’re improving your onboarding process, implementing a continuous approach to performance management, or revisiting your compensation strategy, HR analytics helps you move from reaction to prediction.
By analyzing patterns across performance reviews, engagement scores, and development trends, you can identify where to intervene before issues escalate. Doing so also helps you prioritize the actions that’ll drive the greatest impact, so you can do more with less and focus your resources where they matter most.
How to implement HR analytics in 2025
HR processes have become increasingly fragmented. Small companies now juggle an average of 172 tools across business functions, and HR tech stacks are often a patchwork of survey platforms, performance tools, and outdated spreadsheets.
To deliver the highest value, implement your HR analytics strategy in phases. Here’s how:
- Start with consolidation — Bring all employee data into a centralized system. Platforms like Leapsome's people-centered HRIS act as a single source of truth for workforce information and reduce time spent gathering data across disconnected solutions.
- Prioritize key use cases — Don’t try to track everything at once. First, focus on the metrics that connect most closely with your current business priorities: retention, productivity, and manager enablement are top areas in today’s market.
- Invest in automation and AI — Manual data collection and reporting are too slow for the strategic decision-making your company needs today. Use tools that leverage automation and AI and can help you visualize data, generate reports, summarize feedback trends, and suggest next steps.
- Build a continuous feedback loop — HR analytics represents more than one-off reports. To get the best results, set up systems that store historical data and track trends over time to get the best results. Then, use those insights to adjust policies, support managers, and refine your people strategy over time.
How HR analytics affects business performance
Without a unified view of employee data, HR leaders risk misalignment. According to our 2023 Workforce Trends Report, organizations estimate that over 50% of their employees feel engaged — but reality shows that under one-third are.
HR analytics can close this perception gap. It empowers teams to track progress, pinpoint issues early, and adjust initiatives in real time — driving long-term business and people outcomes.
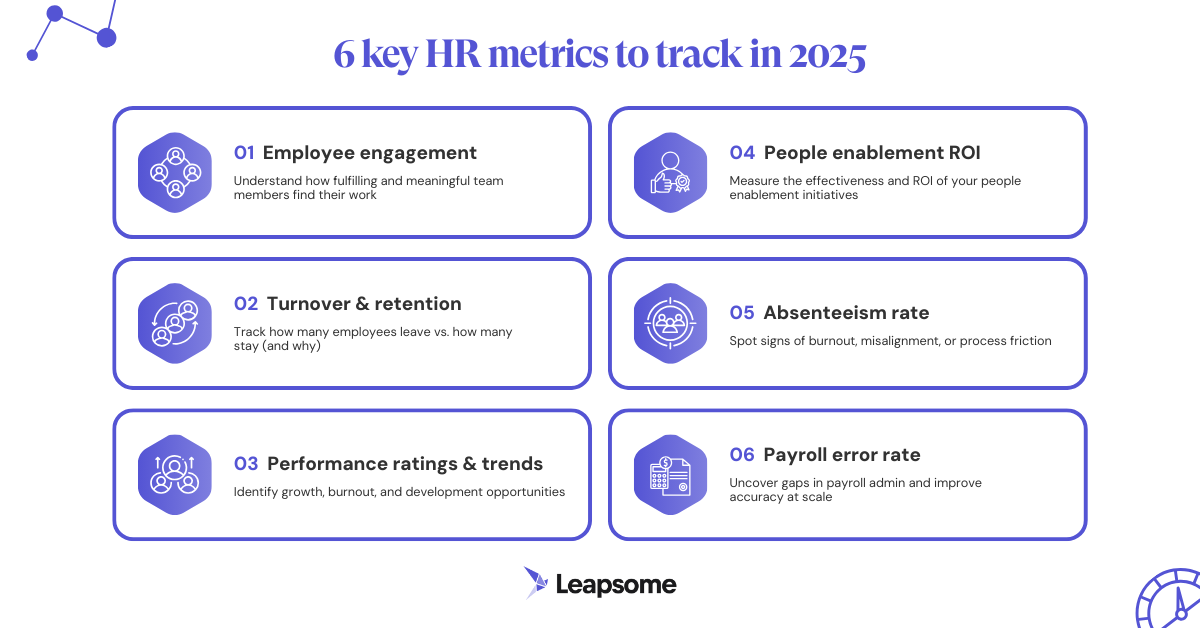
6 key metrics modern HR teams should track
To analyze HR data effectively, you must track and report on key HR metrics that align with your organization’s goals and challenges. While the metrics you focus on will depend on your company’s size, industry, and strategic objectives, the suggestions below are a good starting point.
1. HR metric #1: employee engagement

Employee engagement measures how connected, motivated, and invested employees are in their day-to-day work and the company’s success. Pay particular attention to:
- Employee net promoter scores (eNPS) — This metric determines how many team members are highly engaged and satisfied at work (aka “promoters”) and how many are disinterested (aka “detractors”). The eNPS is calculated using responses to engagement surveys.
- Recognition frequency — Employee recognition programs are a great way to identify engagement trends. For example, team members who frequently post or receive praise via in-company appreciation tools might feel more fulfilled.
- Meeting attendance — Keep an eye on team participation in regular meetings and 1:1s. This can provide insights into engagement levels or indicate a need to improve team involvement, communication, or availability.
Alone, the metrics above can serve as a useful benchmark, giving you ideas on how to boost workplace fulfillment; together, they create a robust roadmap for improving employee engagement at scale. That means it’s crucial to use HR analytics tools that draw on data from multiple sources to give you comprehensive metrics. For example, if your eNPS dips after organizational restructuring, you might combine it with pulse survey data to identify the departments that need more immediate support.
Leapsome’s HR platform includes a surveys module and all people enablement features you need — plus, a human resources information system (HRIS). It collects and synthesizes all your people-related data into a centralized single source of truth, with a dashboard that makes it easy to visualize key information.
HR metric #2: turnover & retention
.png)
Turnover rate represents the percentage of employees who leave during a specific period, while retention rate reflects how many stay. There are ways to measure turnover or attrition. These are some:
- Voluntary vs. involuntary turnover — Helps you distinguish between engagement-driven exits and performance-related or structural departures.
- Average employee tenure — A high-level indicator of satisfaction and career growth opportunities within your organization.
- Retention rate by department or level — Highlights where churn is concentrated so you can dig into manager effectiveness, team structure, and workload.
- Exit interview themes — These can reveal root causes behind departures and patterns in feedback that can inform retention strategies.
Calculations broken down by department and seniority can also reveal more granular insights, like which teams are experiencing higher turnover rates and may require additional support or leadership development.
💡 In addition to these metrics, record qualitative employee feedback from exit interviews or surveys. This can help improve your hiring and talent management process.
3. HR metric #3: performance ratings & trends
Employee performance ratings measure a team member’s success in their role. The most common way of determining these ratings is through 360° reviews, which gather manager, peer, and report feedback, as well as self-assessments (and can even include client reviews).
A moment-in-time performance rating can be helpful, but continuously tracking a team member’s performance evolution is even better. Aggregated data can reveal patterns in performance that correlate with specific projects, seasons, or company initiatives. It can also point to trends in an employee’s development, highlighting improvements or declines in performance that may indicate a need for support.
Here are some metrics to keep in mind:
- 360° review scores (manager, peer, and self-assessments) — Offers a well-rounded view of individual performance and collaboration across functions.
- Rating distribution across teams — Identifies potential bias or inconsistency in how managers evaluate performance, helping standardize expectations.
- Performance trends over time by role or level — Uncovers long-term improvement or stagnation patterns and helps tailor development programs accordingly.
HR metric #4: people enablement ROI
People enablement means giving employees everything they need to do their best work and nurturing their career growth and development — which translates into more impact for your business.
However, these initiatives are most valuable when they lead to measurable outcomes and a clear return on investment (ROI). Demonstrating strong ROI also makes it easier to get C-level buy-in and secure funding for similar initiatives moving forward.
To better understand how well you’re enabling team members, track the following metrics:
- Learning path completion — This metric quantifies how many team members complete assigned training. Tools like Leapsome Learning can provide detailed reports on course completion rates, progress through learning paths, and insights into where employees stumble in the learning process.
- Skill acquisition metrics — You can understand how effectively employees gain and apply new skills by looking at certificates achieved and progress along a clear competency framework. It’s also helpful to rely on manager feedback to determine whether a team member is progressing in their career path.
💡 Pro tip: Quantify your HR impact
Want to make a compelling case for your people enablement initiatives?
Use Leapsome's ROI calculator to see how much you could save by investing in your people.
HR metric #5: absenteeism rate
Your absenteeism rate measures unplanned employee absences over a period (e.g., due to illness or personal emergencies).
A high absenteeism rate can indicate various things. Perhaps employees are burned out or fatigued because their workload is too high. Or maybe you need to revise your paid time off (PTO) policy.
Remember: a generous policy with plenty of flexible PTO, vacation, and sick leave allotments contributes to employee well-being and enables them to do their best work.
Here are some ways to track absenteeism rate:
- Absences per employee per quarter — Establishes a baseline to spot unusual spikes that may indicate burnout or team-wide issues.
- Absence trends by role or department — Helps detect patterns that may correlate with workload, team culture, or ineffective management.
- Overlap with manager or team member absences — Flags coordination gaps or team-wide disengagement, especially when critical roles are frequently offline at the same time.
HR metric #6: payroll error rate
The payroll error rate measures the percentage of inaccurate payroll runs — including incorrect compensation, missing bonuses, or misclassified employee data. Even minor payroll errors can negatively impact employee trust and increase admin overhead. Plus, repeated issues can cause compliance risks, missed payouts, and reputational damage. Off-cycle payroll runs due to inaccuracies also consume a lot of time for HR teams that need to reconcile data manually.
You can calculate the payroll error rate per payroll run (if you just want a high-level idea) or per payslip (which is more detailed and valuable if you run payroll for a large team).
Centralizing employee data can make payroll admin easier and reduce errors — but only if it’s well-organized and easy to access. Pulling information from scattered tools slows down analysis and allows opportunities for mistakes to happen. Leapsome’s HRIS simplifies this by consolidating employee records, time tracking, payroll, and compensation into one system.
Payroll and attendance data can reveal patterns in resource allocation, highlight compliance risks, and expose gaps in pay equity. And with Leapsome’s compensation tool, you can benchmark salaries, spot discrepancies, and ensure your pay practices are fair and competitive.
Best practices for effective HR analytics
Now that we’ve covered how key metrics can help, it’s essential to understand how to implement and leverage your insights. Whether you’re just beginning your HR analytics journey or looking to refine your existing processes, these best practices will help you maximize impact.
Choose the right HR analytics tool
.png)
Leapsome is a comprehensive HR platform with built-in, advanced HR analytics
Finding the right HR analytics tool for your organization depends on a few factors, including your company size, budget, and data complexity. Options include:
- Spreadsheets — Manual tools like Excel or Google Sheets are low-cost but become hard to manage as data volume grows. They also lack security, real-time updates, powerful analytics, and automation features.
- People analytics software — These dedicated solutions can handle data, generate reports, and offer visualizations like charts and graphs. They can be a good way of starting with analytics, but they’re often not scalable; if they don’t integrate with your other tools and systems, you could end up with fragmented data spread across multiple platforms.
- HRIS — Fragmented data is one of the biggest barriers to effective HR analytics. Advanced HRIS software options like Leapsome eliminate silos by consolidating all employee information into a single system. With integrated reporting, automated exports, and AI-powered recommendations, our HRIS makes extracting insights, flagging inconsistencies, and acting on trends easier. It’s built for companies with complex data needs who want a data-driven people enablement strategy.
Build out success metrics based on your HR initiatives
What inspired you to explore HR analytics? You may aim to use data for more strategic HR decisions or improve retention. These initial goals can serve as key performance indicators (KPIs) or success metrics in disguise.
It’s best to identify and codify KPIs before running numbers. For instance, if your goal is to increase retention, you might target increasing the average employee tenure by 2-3 months within the following year. Setting precise, measurable key results allows you to track progress, identify trends, and make informed decisions that propel your HR strategy forward.
For a deeper dive, check out our guide to defining objectives and key results (OKRs) to effectively align your HR analytics with overall HR goals.
Align analytics with business objectives
So, you’ve identified clear success metrics fitting your HR team’s growth plan. The next step is to see how these goals connect with your organization’s broader objectives.
Aligning your HR analytics program with broader business objectives is critical. To ensure smooth progress, schedule regular check-ins with key stakeholders from other departments to discuss the progress of your HR analytics program.
Also, clearly and often communicate how your KPIs align with the company’s mission statement or overall goals. For example, if your organization is in a high-growth phase, your goal might be to use data to improve hiring processes or predict talent needs.
Leapsome Goals can be invaluable in this process. It allows you to create a clear hierarchy of objectives, linking individual goals to company-wide objectives and offering cascading goal visualizations. And with real-time tracking, you can see progress at all times and every level.
Collect data securely & effectively
Accurate and secure data is the foundation of good HR analytics. Data errors can mislead your analysis, and poor security can expose your organization to risks, fines, and a loss of employee trust.
Take a proactive approach to keeping your data secure. Ensure that sensitive applicant or employee data is submitted through encrypted systems, and use tools that follow the principle of least privilege (PoLP) — meaning employees only have access to the data they need for their jobs. This keeps sensitive employee data on a “need-to-know” basis.
It’s crucial to choose an HR platform that prioritizes data security. Leapsome’s HRIS is designed with compliance and data protection at its core. As a GDPR, CCPA, and ISO-compliant system with encryption, access controls, and compliance reporting features, our platform helps you adhere to data protection regulations and ensure a sensitive, ethical approach to analytics.
Visualize & communicate your analytics
.png)
Effective data visualization turns raw numbers into insights that stakeholders can easily understand and act on — especially colleagues outside HR who may lack full context on your metrics and goals.
Use graphs, charts, and dashboards to clearly communicate patterns and other insights. HR analytics solutions that automate data visualization will help you identify trends faster, freeing time to focus on turning insights into action.
Leapsome’s people analytics and HRIS tools consolidate critical data on employee engagement, career goals, and manager feedback into easy-to-digest visuals. HR professionals can switch between their favorite views, from lists to heatmaps, to gain a deeper understanding of HR data.
Streamline the process with AI
Automation reduces time spent on manual HR reports, making it easier to interpret and share data, gather feedback, and generate insights; AI-powered HR tools can even offer data-driven suggestions based on employee data.
Leapsome incorporates AI to help you turn HR data into action by summarizing key information (including survey results, feedback, and reviews) and translating it into practical suggestions for improvement.
✨ Fast-track your HR analytics with AI
Turn raw data into actionable insights — empowering your HR team, managers, and employees.
👉 Book a demo
Frequently asked questions about HR analytics
What’s the difference between HR analytics, people analytics & workforce analytics?
While the terms HR analytics, people analytics, and workforce analytics are often used interchangeably, these terms differ in scope:
- HR analytics focuses on core HR goals like improving hiring, retention, and engagement.
- People analytics takes a broader view, connecting employee data across departments to assess overall organizational health.
- Workforce analytics focuses on productivity and performance metrics to optimize team structures and skill development.
Vanda Williams


.jpg)


Ready to transform
your People operations?
Automate, connect, and simplify all HR processes across the employee lifecycle.
.webp)
.webp)
 Request a demo today